Optimise · Data & analytics

Every asset. Every rand.
One live view.

Every system we install is watched from the day it is switched on. Your solar, your chargers and your car on one dashboard — what they generated, what they earned, what they cost, by the hour and in rands as well as kilowatt-hours. So the saving you were promised is a number you can check, not a claim you have to take on trust.

96.7%
Portfolio performance
Hourly
Financial & energy tracking
One hub
Every document, one place
Portfolio monitoring · independent of who installed it

We did not have to build it
to tell you how it is performing.

Own a property portfolio with solar already on the roofs? You were sold a business case. Somebody should be checking it. Halfway Charge monitors plants we did not install, holds them to the numbers they were sold on, and keeps the installer honest about maintenance — because the person who built it is rarely the right person to mark its homework.
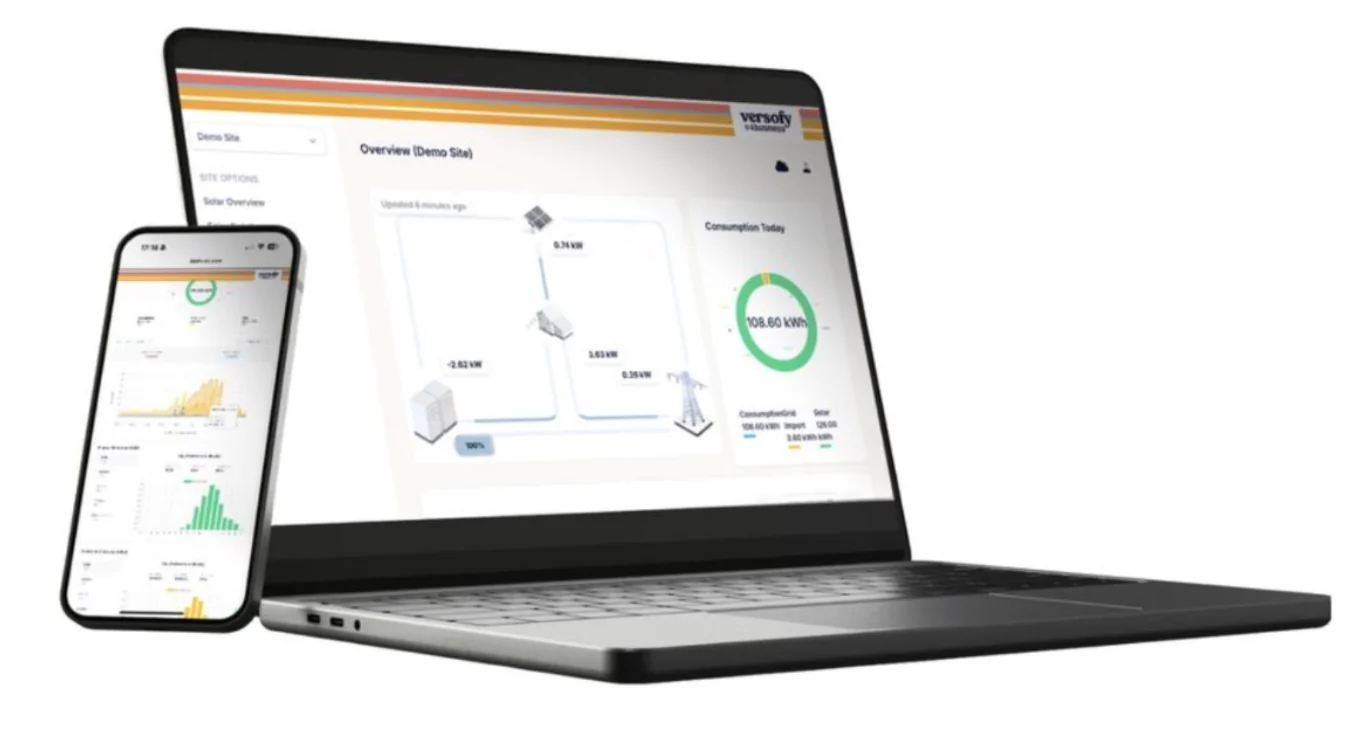
The Halfway Charge dashboard on a laptop and a phone
Load the targets

Upload the original business case, or let us remodel it properly. Either way there is a number on the wall to measure against.

Hold the financials

Month by month, generation reconciled against the actual utility account. Underperformance shows up as rands, not as a graph nobody reads.

Keep maintenance honest

Cleaning, faults, inverter downtime and response times, all logged and visible. An SLA is only worth what someone is willing to check.

One integrated stack

Purpose-built CRM, our bureau team and Dash-IOT working together — so the reporting arrives finished, not as data for you to interpret.

Multiple property portfolios are already live on it. Add yours, and see the first month before you commit to anything.
The dashboard · live demo

Seeing is believing.

Every claim on this page is checkable. Here is the front door to a real Halfway Charge installation, reporting live — open it and judge for yourself.

Optimise

See a live site in action.

Not a screenshot. Not a mock-up. Watch the solar climb as the sun does, the grid draw fall away, and the money move — the same view every client is handed on day one.

Open the live dashboard
Sign in with
Site
dash-iot.com
Username
demo
Password
demo

Opens in a new tab. Nothing to install and nothing to sign — look around for as long as you like.

What the layer does

Data turns four products
into one ecosystem.

Live performance dashboards

Energy and financial performance by the hour for every asset — solar yield, charger utilisation, savings against tariff, and performance against guarantee.

Offset validation

We do not just promise a solar offset. The dashboard proves it, month after month, against your actual bill and tariff structure.

One secure document hub

Every project document — proposals, engineering packs, COCs, SLAs and handover files — in one place, for the life of the system.

SLA-backed accountability

Monitoring feeds our maintenance SLAs. Faults are seen the hour they happen, call-outs are dispatched, and uptime is reported rather than assumed.

Transparent check meters

A second meter on every site, independent of the utility's own. Every kilowatt-hour is counted twice by two separate devices, so the analytics rest on a verified record rather than a single feed — and if one drops, the other carries it.

AI bill check

Upload a municipal bill and it is read line by line, then set against the same period on the dashboard. Tariff, consumption and charges are compared automatically, so a billing error surfaces as a discrepancy you can query instead of one you never see.

The compounding effect

Each layer makes
the others smarter.

Your EV tells the charger when it needs power. The charger asks solar for the cheapest hours. The dashboard watches all of it — and shows you the money.

Portfolio performance: 96.7%Across the monitored portfolio, systems deliver 96.7% of modelled output — measured, not estimated. That is the number our 90% guarantee stands on.
Hourly, not annuallyMost reporting arrives once a year in a PDF. Ours updates every hour, in a browser.
Financial, not just technicalKilowatt-hours are the input. Rands saved against your tariff are the output.
Basic details, nothing more

Tell us what you want to see.
We will set up the demo.

A name, an email and roughly what you are after — that is all we need to start. We will walk you through the live dashboards on real sites, not a slide deck.